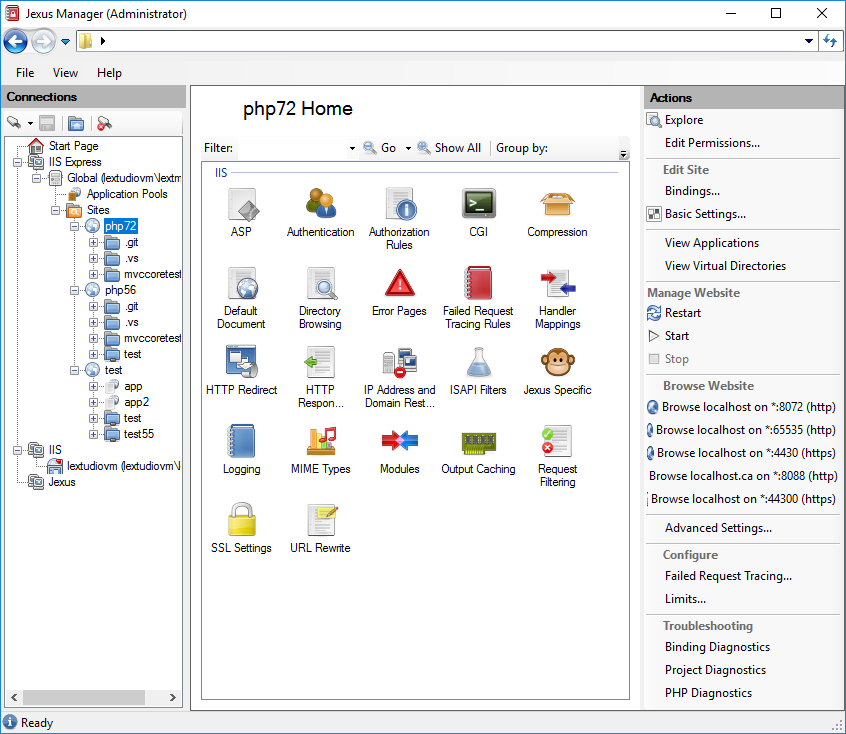
New Screenshot of Jexus Manager
Introducing the updated Jexus Manager 12.0.60.0 with improved server type organization, enhanced diagnostic tools, and numerous bug fixes for better IIS management.
The screenshot used in Jexus Manager homepage and documentation has just been replaced by the one above. It is time to use this new version, as many important changes are reflected.
Firstly, the server types are clearer, as different server instances are organized under “IIS Express”, “IIS”, and “Jexus” nodes. Each server types use different icons.
Secondly, diagnostics tools bundled in Jexus Manager has been updated frequently, and now we have Binding Diagnostics, Visual Studio Project Diagnostics, PHP Diagnostics, and SSL Diagnostics. The report contents have been revised constantly based on feedbacks collected from Stack Overflow, so now each contains more practical information to assist troubleshooting.
SSL Diagnostics is not shown in the screenshot, as it is only available at server level, not site level.
Lastly but invisibly, many exceptions have been fixed, after iterations of development and tons of anonymous reports sent by users. When an exception must be thrown, the new version of Jexus Manager also makes sure the exception message is clear and leads you toward the solution.
For example, in the past you might add any XML file as IIS Express server instance, but now the file name is being validated and a warning is displayed if the file does not seem to be valid.
The current version is 12.0.60.0. Stay tuned for more updates in the coming months.
